As part of my Data Analytics and Visualization course I decided to do my final project on a Walmart dataset found on Kaggle that would challenge my data analysis skills with its anonymized data and my curious mind looking for insight.
In this post I share the notes I wrote while working in the project and include the final presentation and repport that I presented this end of course project (use the table of contents to navigate or go through all of it at your own peril).
Finding a project
Finding a dataset was not easy, and I went through a lot of pages looking for an interesting dataset that would both:
- Include time series
- Be about a business
I went on a searching rampage, starting with the Belgian open data website: data.gov.be. I also searched among Kaggle’s datasets, but I initially did not want to use them because they are oriented to machine learning and the sets did not seem very challenging for the data wrangling and ETL.
Google’s Data Search was helpful but had the same shortcomings as all the other sites I went through: it is impossible to drill down with your preferences to only choose from a few relevant datasets.
At the end I had to go through a lot of descriptions and keep tab groups for a few days until it came down to two sources. The French bakery lost because I thought it would be more interesting to have data from multiple stores and different locations. I can always use it for another project :)
Why I chose this Walmart dataset
Altough the dataset was part of a machine learning challenge I thought that I could do something interesting trying to figure out a few things out of the anonymized data they provided.
The set responded to my two requirements: it was business content, and included time series.
The range of time was not very long (a bit under three years, from 2010-02-05 to 2012-11-01) but allowed me to explore seasonality and the impact of holidays and markdowns. As an extra in case things went smoothly and I had extra time (spoiler: I didn’t), I could also explore weather, PCI and unemployment data.
The data
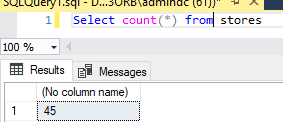
The data was a selection of 45 stores with over 400_000 rows, including three misteryous types of stores, and 81 departments. Unfortunately there was no location data and the departments were not tagged, so I couldn’t know what was being sold.
Source Data
I downloaded the orignial data from Kaggle. It contained 5 CSV files…:
- features.csv
- stores.csv
- test.csv
- train.csv
- sampleSubmission.csv
… of which I only used the features, stores and train files.
The train.csv had sales data which included:
- Store - the store number
- Dept - the department number
- Date - the week
- Weekly_Sales - sales for the given department in the given store
- IsHoliday - whether there is holiday
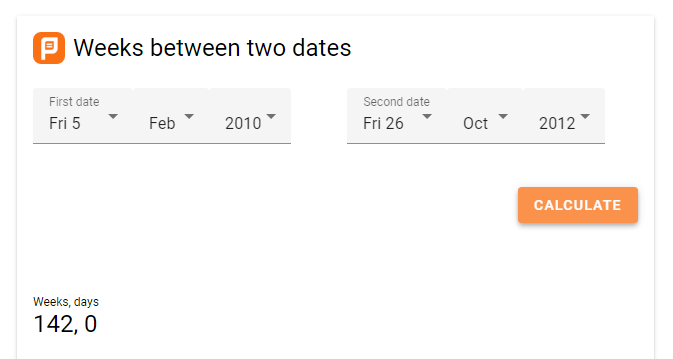
- Sales go from Feb 05 2010 to October 26 2012
The features.csv files had these columns:
- Store - the store number
- Date - the week
- Temperature - average temperature in the region
- Fuel_Price - cost of fuel in the region
- MarkDown1-5 - anonymized data related to promotional markdowns that Walmart is running. MarkDown data is only available after Nov 2011, and is not available for all stores all the time. Any missing value is marked with an NA.
- CPI - the consumer price index
- Unemployment - the unemployment rate
- IsHoliday - whether the week is a special holiday week. These holidays where highlighted in the Kaggle challenge and I used them for the analysis:
- Super Bowl: 12-Feb-10, 11-Feb-11, 10-Feb-12, 8-Feb-13
- Labor Day: 10-Sep-10, 9-Sep-11, 7-Sep-12, 6-Sep-13
- Thanksgiving: 26-Nov-10, 25-Nov-11, 23-Nov-12, 29-Nov-13
- Christmas: 31-Dec-10, 30-Dec-11, 28-Dec-12, 27-Dec-13
The stores.csv file only had three columns and 45 lines: - Store - the store number - type - A, B or C type - Size - store size
About Walmart
To get a feel about the company, I read their Wikipedia page and skimmed some annual repports.
These are the highlights:
- Launched by Sam Walton in 1962
- 10,586 stores
- 24 countries
- $570 billion annual revenue
- 2.2 million employees
- 10,586 stores and clubs
- 24 countries
- $570 billion in annual revenue (65% USA)
- Largest employer in the world: 2.2 million employees
- Walton family controls over 50% of Walmart
- USA store brands:
- Walmart
- Sam’s Club
- USA divisions:
- Supercenters
- Discount Stores
- Neighborhood markets
Diving in: how I worked with the data
All the notes below come from the documentation notes I took while working on the project. Please excuse the eventual succinctness.
Assumptions
- Negative sales mean that there have been more returns than sales.
- Store size is in square feet
- Temperature is in degrees Farenheit.
- Money is US$
- Long numbers in Unemployment ant CPI are decimal numbers missing the separator.
- US formatting of dates and numbers.
- Department numbers refere to the same department across all stores.
- The initial SQL database emulates a production DB, so the import of the original csv files will only have to be made once.
- Stores is the main table, the others connect via it.
- anonymized data related to promotional markdowns that Walmart is running. MarkDown data is only available after Nov 2011, and is not available for all stores all the time.
Tools
For this project my heart was telling me to work with Python, but I decided to go with a set of tools that are more demanded when looking for a job:
- T-SQL and SQL Server Management Studio (SSMS)
- Visual Studio and SQL Server Integration Services (SSIS)
- Power BI
Initial import and wrangling
Preview CSV files
Explored CSV files with Libre Office to get a feel for the data, check data types, look for inconsistencies, and find keys to link them.
- stores.csv (headers + 45 lines):
- Store: Int 🔑.
- Type: Category or String.
- Size: Int.
- train.csv (headers + 536_635 lines):
- Store: Int 🔑.
- Dept: Int.
- Date: Date 🔑.
- Weekly Sales: $.
- Is Holiday: Boolean 🔑.
- features.csv (headers + 8190 lines):
- Store: Int 🔑.
- Date: Date 🔑.
- Temperature: Decimal.
- Fuel Price: ⚠️ Pricing not uniform, mix of Int and Dec as string.
- Markdown 1 to 5: Decimal, lots of NA.
- CPI: Float.
- Unemployment: not uniform, mix of Int and Dec as string.
- Is Holiday: Boolean 🔑.
Create DB
Created database Walmart with SSMS.
Create SSIS project
Create SSIS project Walmart Source Data to import data.
Import CSV files
Stores
Import stores table and check that the same number of rows is present:
CREATE TABLE [Stores] (
  [Store] smallint IDENTITY(1,1),
  [Type] varchar(1),
  [Size] int
)
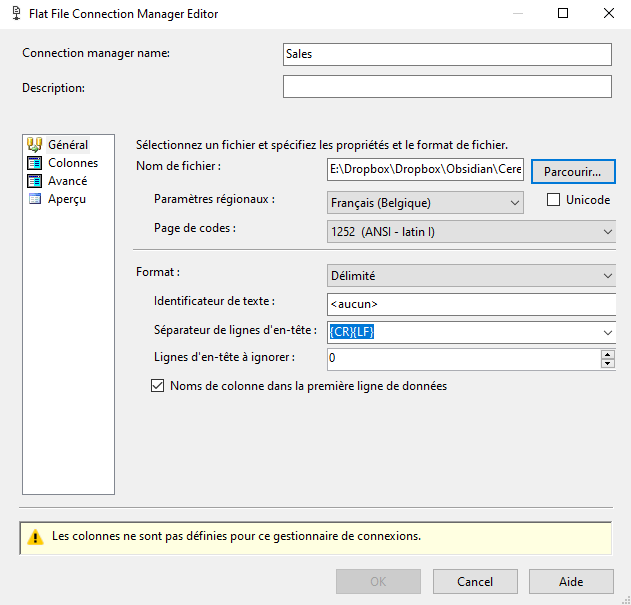
Sales
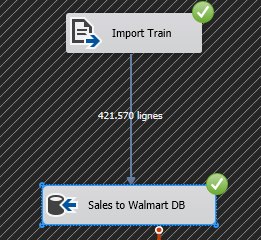
Only imported the train.csv dataset because the test.csv dataset did not have any sales data (the column does not exists). I guess this was part of the ML challenge.
Create table on SSMS:
USE Walmart
GO

CREATE TABLE Sales(
	Store smallint not null,
	Dept smallint,
	[Date] datetime,
	isHoliday bit,
	weeklySales DEC
)
Dates have been converted to DateTime.
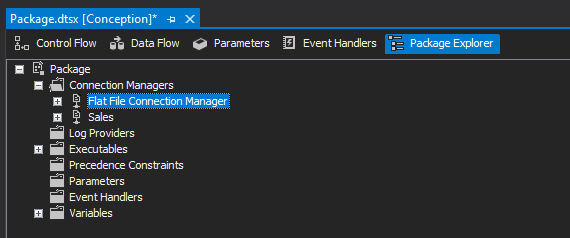
SSIS
Import through SSIS.
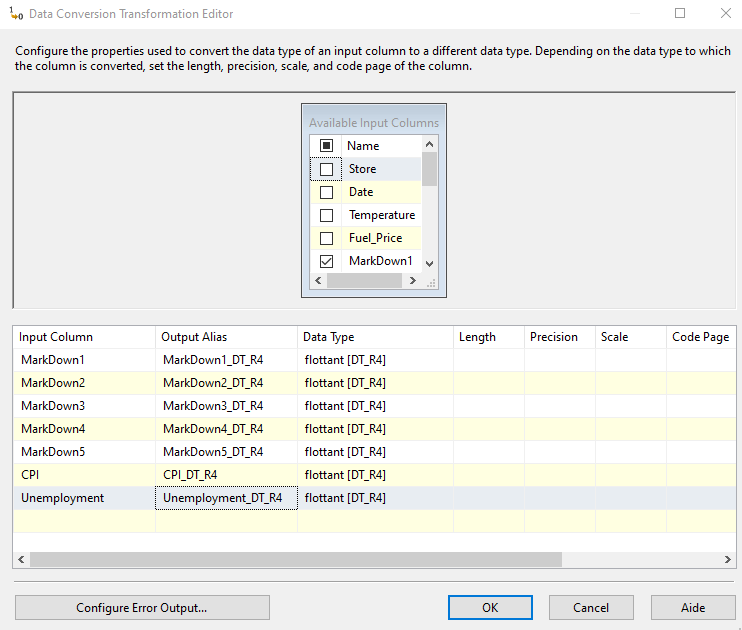
Features
Import the columns that SSIS has trouble with (Markdown, Unemployment, CPI) as string, clean up and then convert to flottant [DT_R4].
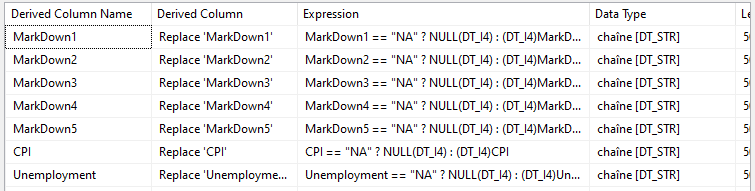
NA to NULL
Pay attention to the original text, it was not NaN.
MarkDown1 == "NA" ? NULL(DT_I4) : (DT_I4)MarkDown1
MarkDown2 == "NA" ? NULL(DT_I4) : (DT_I4)MarkDown2
MarkDown3 == "NA" ? NULL(DT_I4) : (DT_I4)MarkDown3
MarkDown4 == "NA" ? NULL(DT_I4) : (DT_I4)MarkDown4
MarkDown5 == "NA" ? NULL(DT_I4) : (DT_I4)MarkDown5
CPI == "NA" ? NULL(DT_I4) : (DT_I4)CPI
Unemployment == "NA" ? NULL(DT_I4) : (DT_I4)Unemployment
Change . to ,
I did not manage to make the derived column to work, so I changed it with a search replace on LibreOffice.
Left over "
Made a new connection manager to take care of some left over “.
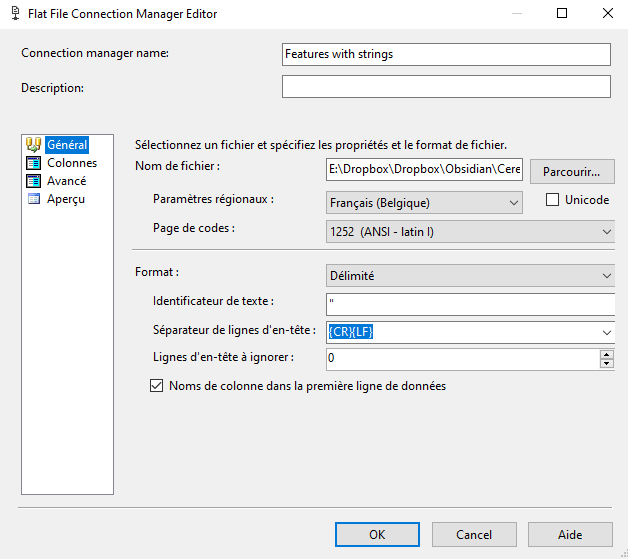
It was causing the error with the NA to NULL task.
Set Keys
Cannot do it via de interface because Null values are allowed on Stores:
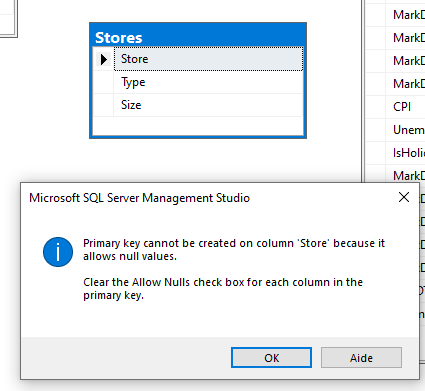 So I remove the allow nulls in all columns of the table via SSMS:
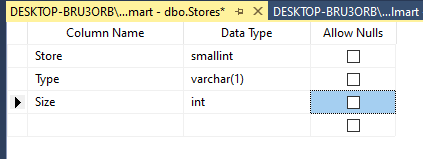 And I set
 Store as the Primary Key (PK) in Stores and as Foreign Key (FK) in the others:
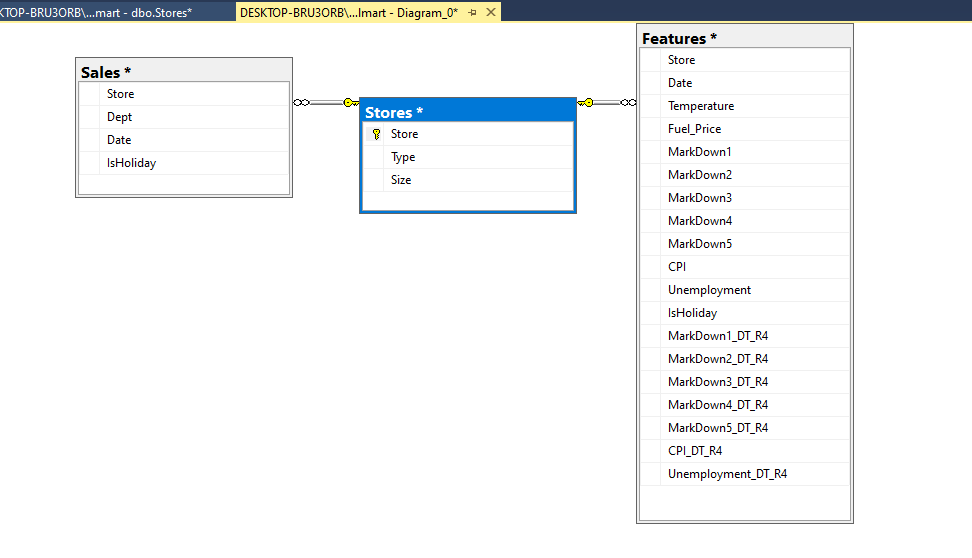 All tables are saved without errors.
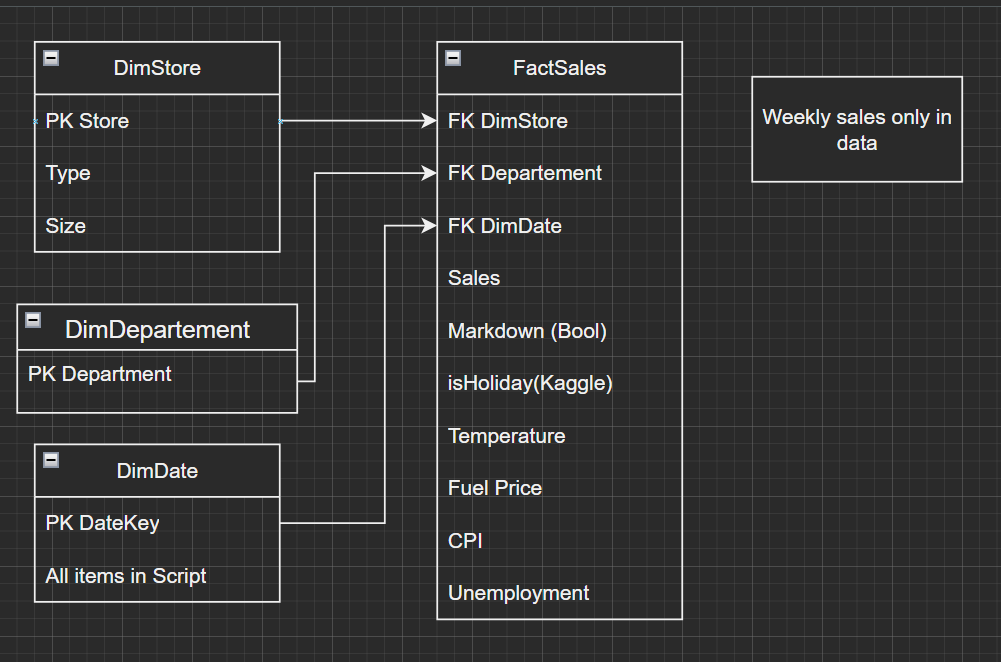
Data Warehouse (DW)
Dimensional Model
Create DW DB
Create Walmart_DW via the SSMS interface.
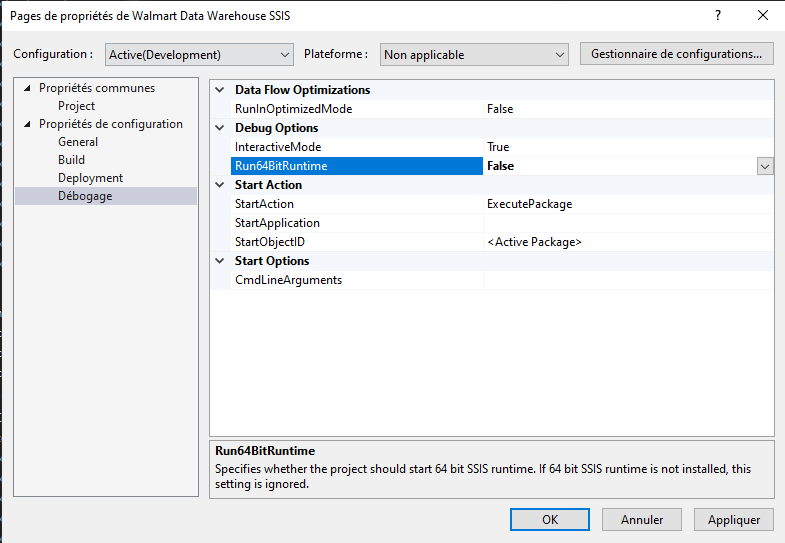
Create SSIS project
Create SSIS project in Visual Studio and immediately change the Run64BitRuntime to false.
Create DimDate from script
Populate DimDate from script we got in class. Script fails because the table [dbo].[dimdate] does not exist. So I saved a Create script from one of the exercises to recreate the table and then run the script to populate it.
Check if holidays match
[[holiday-check.sql]] exploration shows that not a single one matches (tested for 2010):
Walmart operational DB
Date IsHoliday 2010-02-12 00:00:00.000 1 2010-09-10 00:00:00.000 1 2010-11-26 00:00:00.000 1 2010-12-31 00:00:00.000 1
Walmart DW dimensional DB
Date IsHolidayUSA 2010-01-01 00:00:00.000 1 2010-02-14 00:00:00.000 1 2010-03-17 00:00:00.000 1 2010-07-04 00:00:00.000 1 2010-10-31 00:00:00.000 1 2010-12-25 00:00:00.000 1
Focus on dates provided in Kaggle’s description and keep the other ones to run extra analysis if there’s any time left.
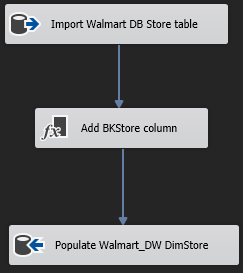
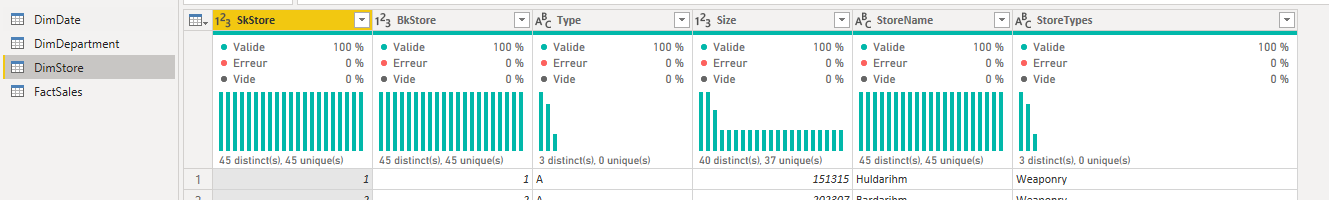
Create DimStore
Via SSMS.
USE Walmart_DW
GO

CREATE TABLE DimStore(
	SkStore INT PRIMARY KEY,
	BkStore INT NOT NULL,
	[Type] VARCHAR(1) NOT NULL,
	Size INT NOT NULL,
)
Populate DimStore
Derived column is used to create the BKStore column
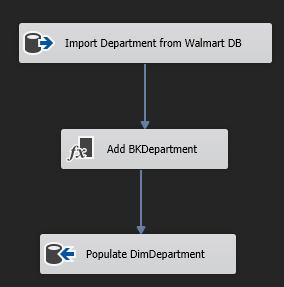
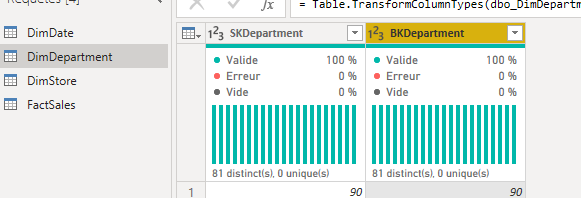
Create DimDepartment
Via SSMS.
USE Walmart_DW
GO

CREATE TABLE DimDepartment(
	SKDepartment smallint,
	BKDepartment smallint
)
Populate DimDepartment
SSIS.
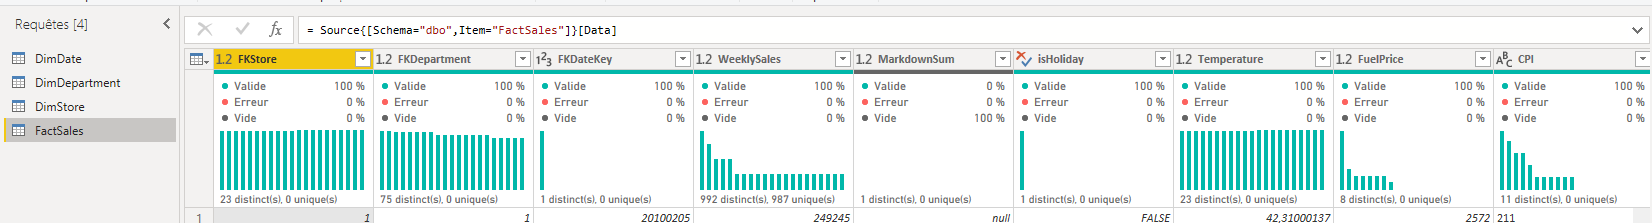
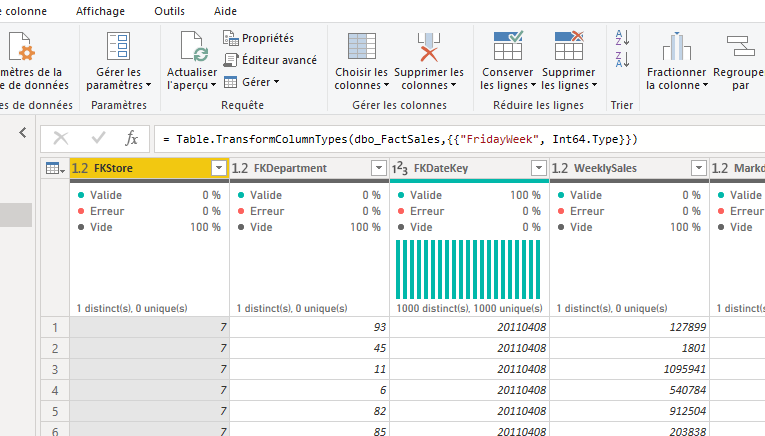
Create FactSales
On SSMS.
USE Walmart_DW
GO
CREATE TABLE FactSales(
FKStore smallint,
FKDepartment smallint,
FKDateKey int not null,
WeeklySales decimal(18,0),
MarkdownSum float,
isHoliday bit,
Temperature real,
FuelPrice real,
CPI varchar(50),
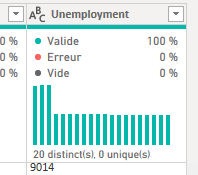
Unemployment varchar(50),
)
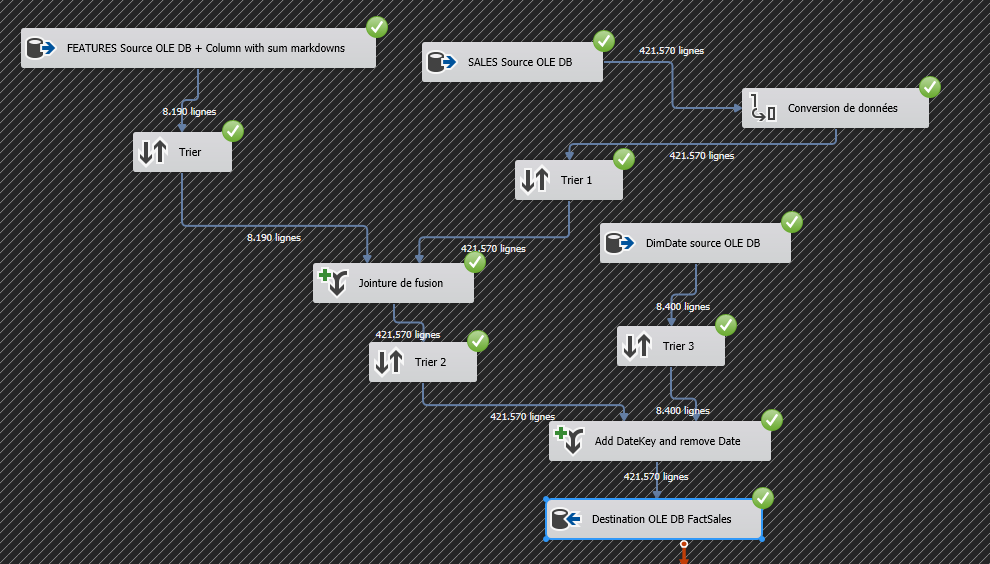
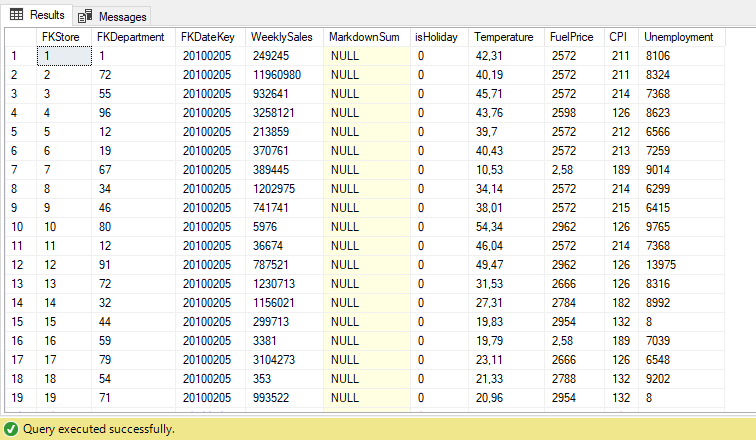
Populate FactSales
The Markdown data is not understandable, so I’ve decided to create a column that adds up all the markdowns and keeps null if there are none. Not working Derived column transformations:
/* Says that OR cannot be used  */
ISNULL(MarkDown1_DT_R4) == FALSE | ISNULL(MarkDown2_DT_R4) == FALSE | ISNULL(MarkDown3_DT_R4) == FALSE | ISNULL(MarkDown4_DT_R4) == FALSE | ISNULL(MarkDown5_DT_R4) == FALSE ? 1 : 0

/* No error but it goes into a loop and does not finish loading */
ISNULL(MarkDown1_DT_R4 + MarkDown2_DT_R4 + MarkDown3_DT_R4 + MarkDown4_DT_R4 + MarkDown5_DT_R4) ? 1 : 0
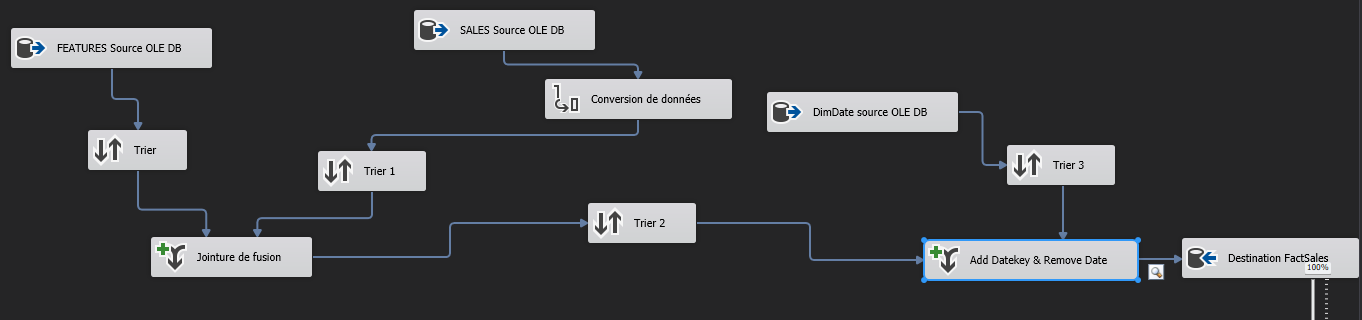
Workaround: used SQL request with Source OLE DB component to create a column with the sum of all markdowns (5 * null = null):
SELECT *, (MarkDown1_DT_R4 + MarkDown2_DT_R4 + MarkDown3_DT_R4 + MarkDown4_DT_R4 + MarkDown5_DT_R4) AS MS
FROM Features
Visual Studio did not execute it: no error but goes on forever, does not even show the data viewer with a union. It ended up being the orphan Sales OLE DB source and that somehow the debugging 64bits option was reset to true.
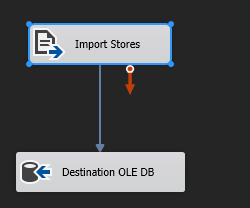
Final SSIS flow:
Reporting
Connect PowerBI to DESKTOP-BRU3ORB\DATAVIZ and import all of Walmart_DW tables.
Check tables
All OK. Only had to change data types for DimDepartment from float to int. No errors on any table.
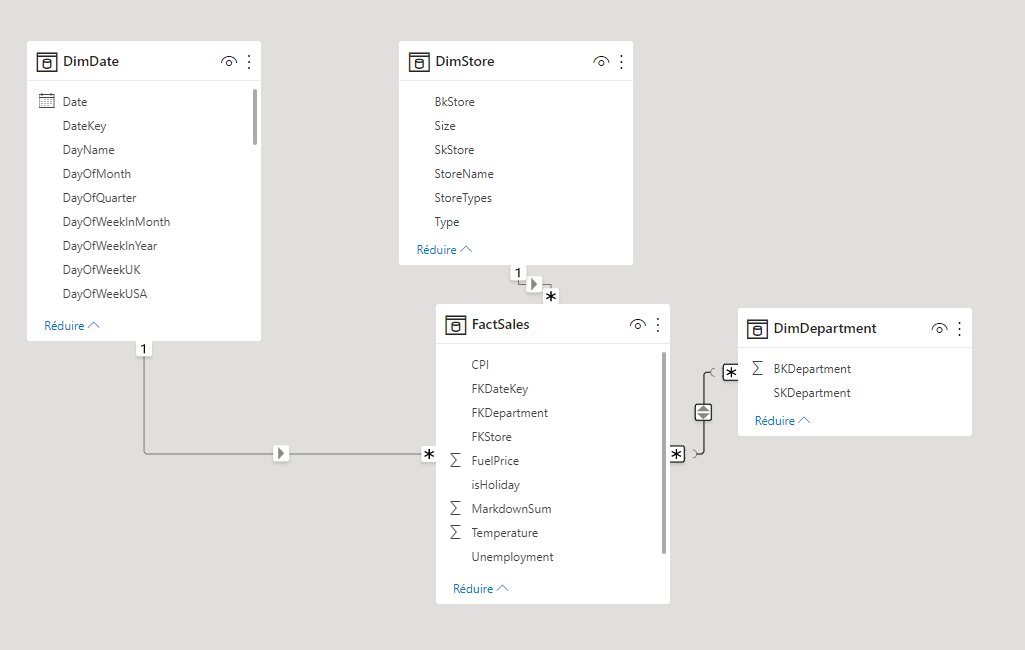
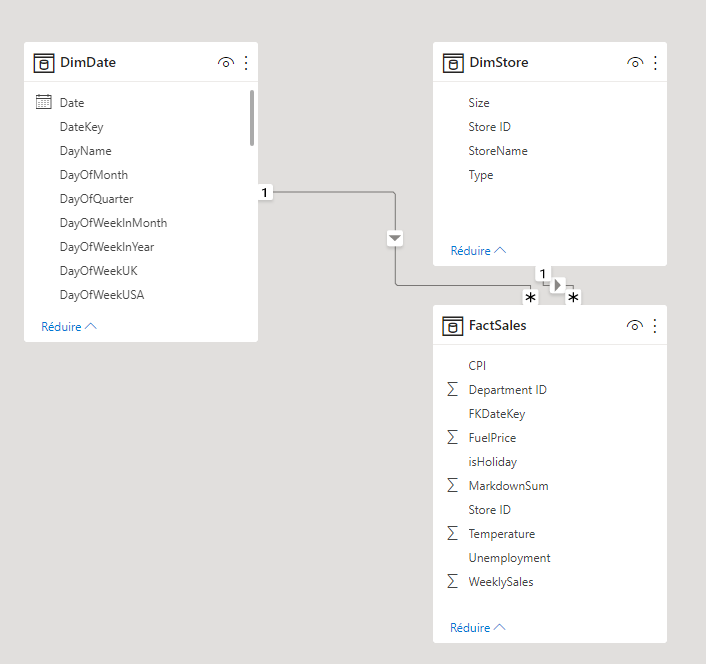
Link tables in the model
Because the DimDepartment link required a many to many relationship and it is not needed, I removed it from the data. I also renamed and deleted some columns, including the Type Name that I had incorrectly tagged (it is not a department).
OLD:
 NEW:
NEW:
Are Store types linked to size?
A and B seem to follow a size pattern, but a few of both share size with group C stores:
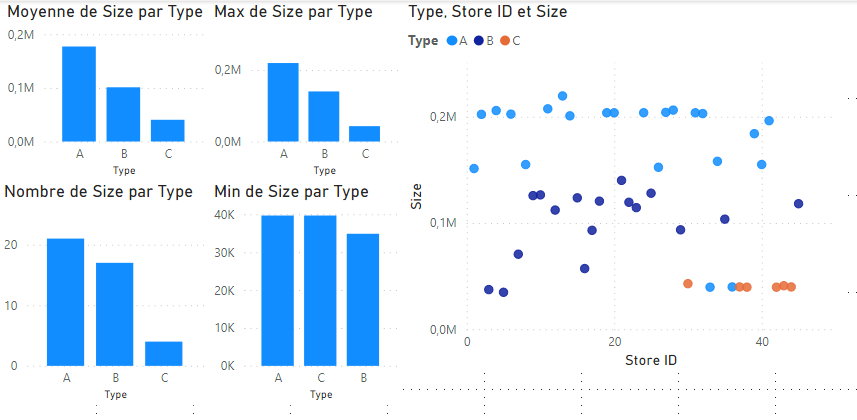
- Are C stores a new type of store?
- Are the outliers errors in the data?
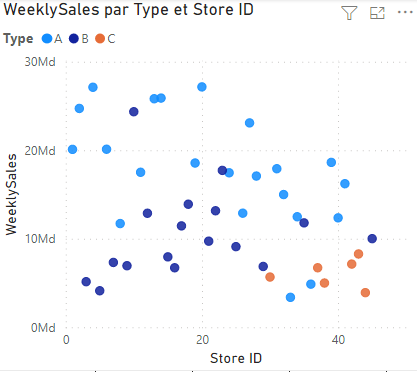
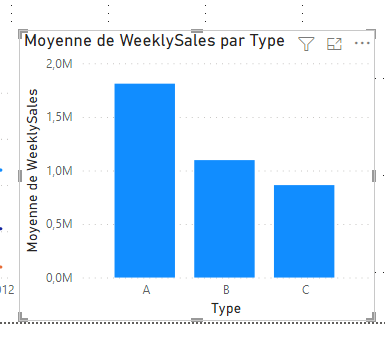
- C Stores do make less money, but so do a couple of type A and a few of type B
- Type C stores use less markdowns
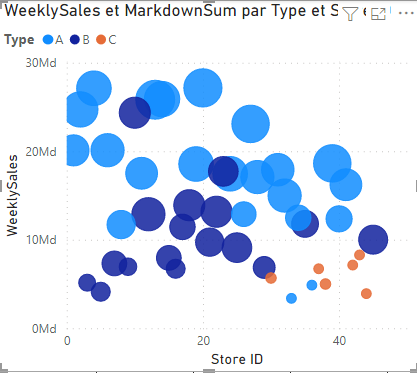
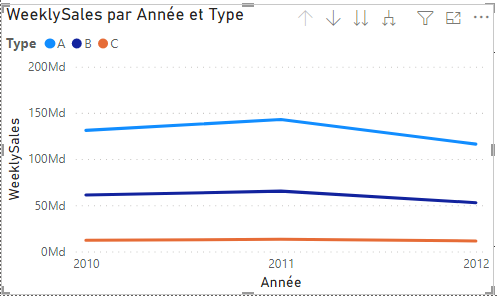
- The type reflects the sales of the stores:
Fix problems with CPI, Unemployment, Temperature
There are numbers in % and others are included without being divided by 100 and also without “.”, so I created new conditional columns to clean up.
= Table.AddColumn(#"Colonnes permutées1", "Unemployment", each if [Unemployment_to_fix] > 9999 then [Unemployment_to_fix]/10000 else if [Unemployment_to_fix] > 999 then [Unemployment_to_fix]/1000 else [Unemployment_to_fix])

= Table.AddColumn(#"Colonnes renommées3", "CPI", each if [CPI_to_fix] > 1000 then [CPI_to_fix]/1000 else if [CPI_to_fix] > 100 then [CPI_to_fix]/100 else [CPI_to_fix])
Add Friday Week
Added a column with the number of the week in that year starting on Saturday and ending on Friday (the day of the sales report) with an SQL query on Sales & Features, to be able to link weeks with IsHoliday to WeeklySales.
[! Attention] When updating a table, go to the editor and click on Refresh view (actualiser l’apperçu)
Power BI
Working with Power BI was straight forward once all the data was formated and in shape. I did not take notes because of this.
Issues
These are some of the issues I encountered with the different tools I used, mostly with Visual Studio and having the SSAS & SSIS extensions crash.
LocaleID not installed
Issue: LocaleID 9 is not installed on this system
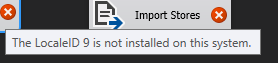 Due to locale chosen for import (English instead of default French Belgium). Fixed recreating with the local locale and deleting previous connection managers:
IF Exists does not work as in SSMS
Discarded code for the time being.
DB creation and population in same Data Flow
 First run creates the table with our script and sometimes it is populated, others it needs a second run without changing anything to populate. The script to create the DB is no longer present, the connection is made.
Data Viewer not displayed.
Change Project>Properties>Config>Debugging>Run64bitRuntime to False.
. to , not working
Done manually with LibreOffice
Temperature conversion
Import Features with some columns as strings to deal with NaN 36 Error: Échec de la conversion de données. La conversion de données de la colonne « Temperature » a retourné la valeur d’état 2 et le texte d’état « La valeur n’a pas pu être convertie en raison d’une perte potentielle de données. ».
Presentation and report
These are the final files that I used for the live presentation (click to open or download). You will find some duplication in the presentation, because I wanted to have some content in case there was any issue with the Power BI presentation. Instead of going with a live Power BI presentation (I’ve seen too many presentations fail) I used a PDF that I was sure would display nicely in the screen of the auditory. I’m used to presenting in front of live audiences so I went first to give my colleagues a bit of extra time to calm down and work on their presenations.
Next
What came next in the presentation and is already done or being worked on right now is:
- Machine learning & statistics courses: I’ve already finished an ML course and I’m working on a couple more. The statistics I’m learning with them don’t require an independent course as the courses I’ve found don’t cover anything else I need now.
- Data exploration with Python: working on this is great. I really enjoy working with Python and Jupyter notebooks.
- Power BI certification: coming up!